ANOVA Analysis
This section explains how to perform an Analysis of Variance (ANOVA) in GeoPopMap, specifically when structure data is available and a quantitative variable is selected in the Map panel.
1. When is ANOVA available?
ANOVA is only available if structure data has been uploaded and merged.
You must select a quantitative (numeric) variable in the Map panel for the analysis to be enabled.
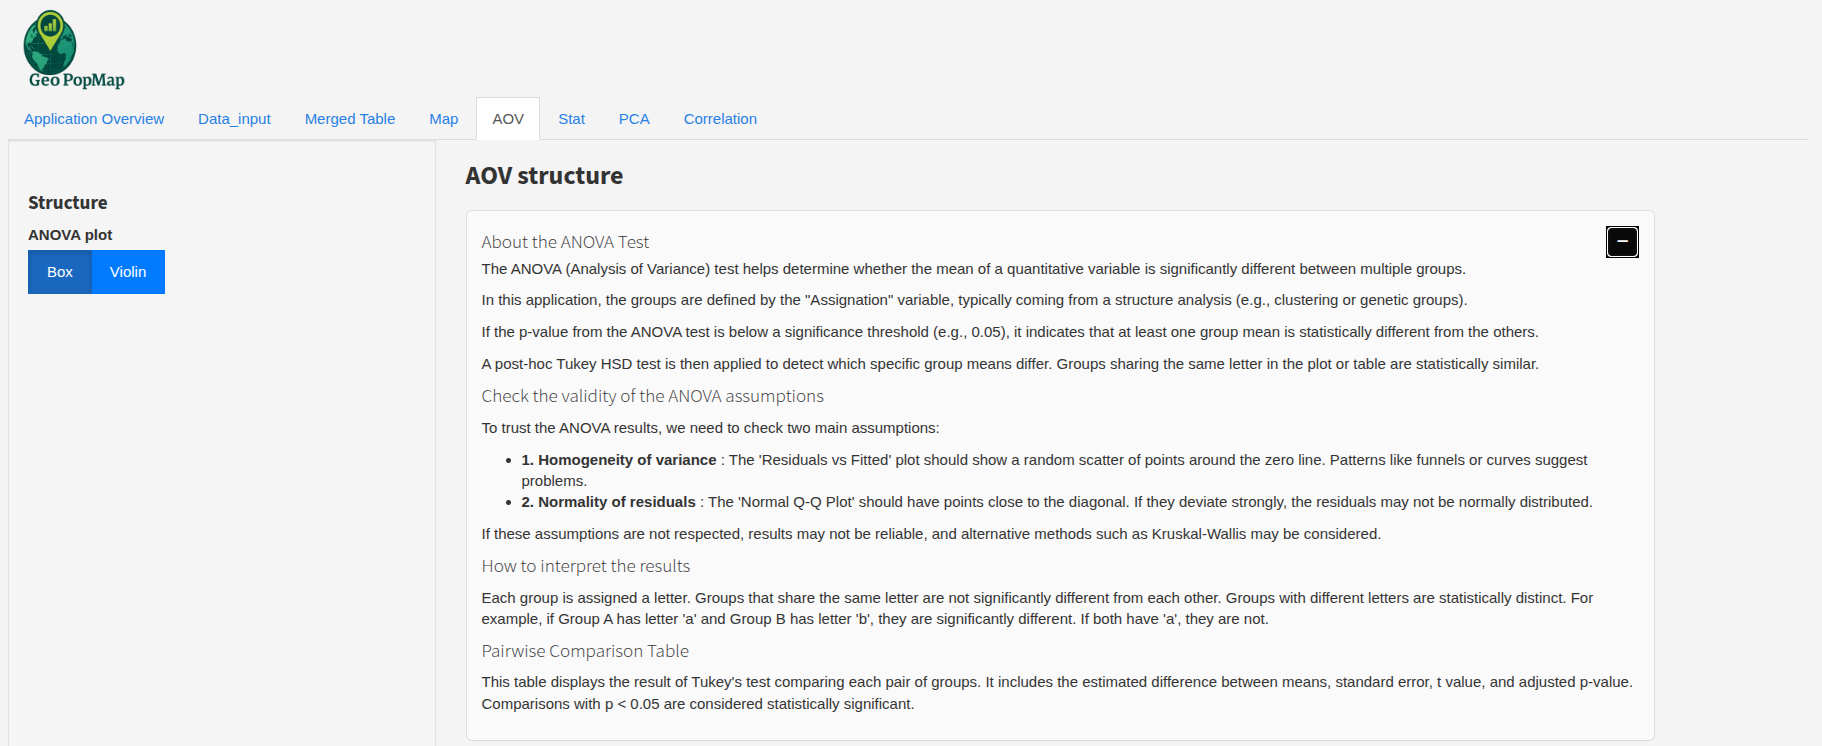
The ANOVA interface becomes available when structure data is present and a numeric variable is selected.
2. How to perform the analysis
Go to the “ANOVA Analysis” tab.
Select the quantitative variable you want to analyze (from the Map panel).
The groups are automatically defined by the structure assignation (e.g., population clusters).
Click the “Run ANOVA” button.
Example: Selecting a quantitative variable for ANOVA.
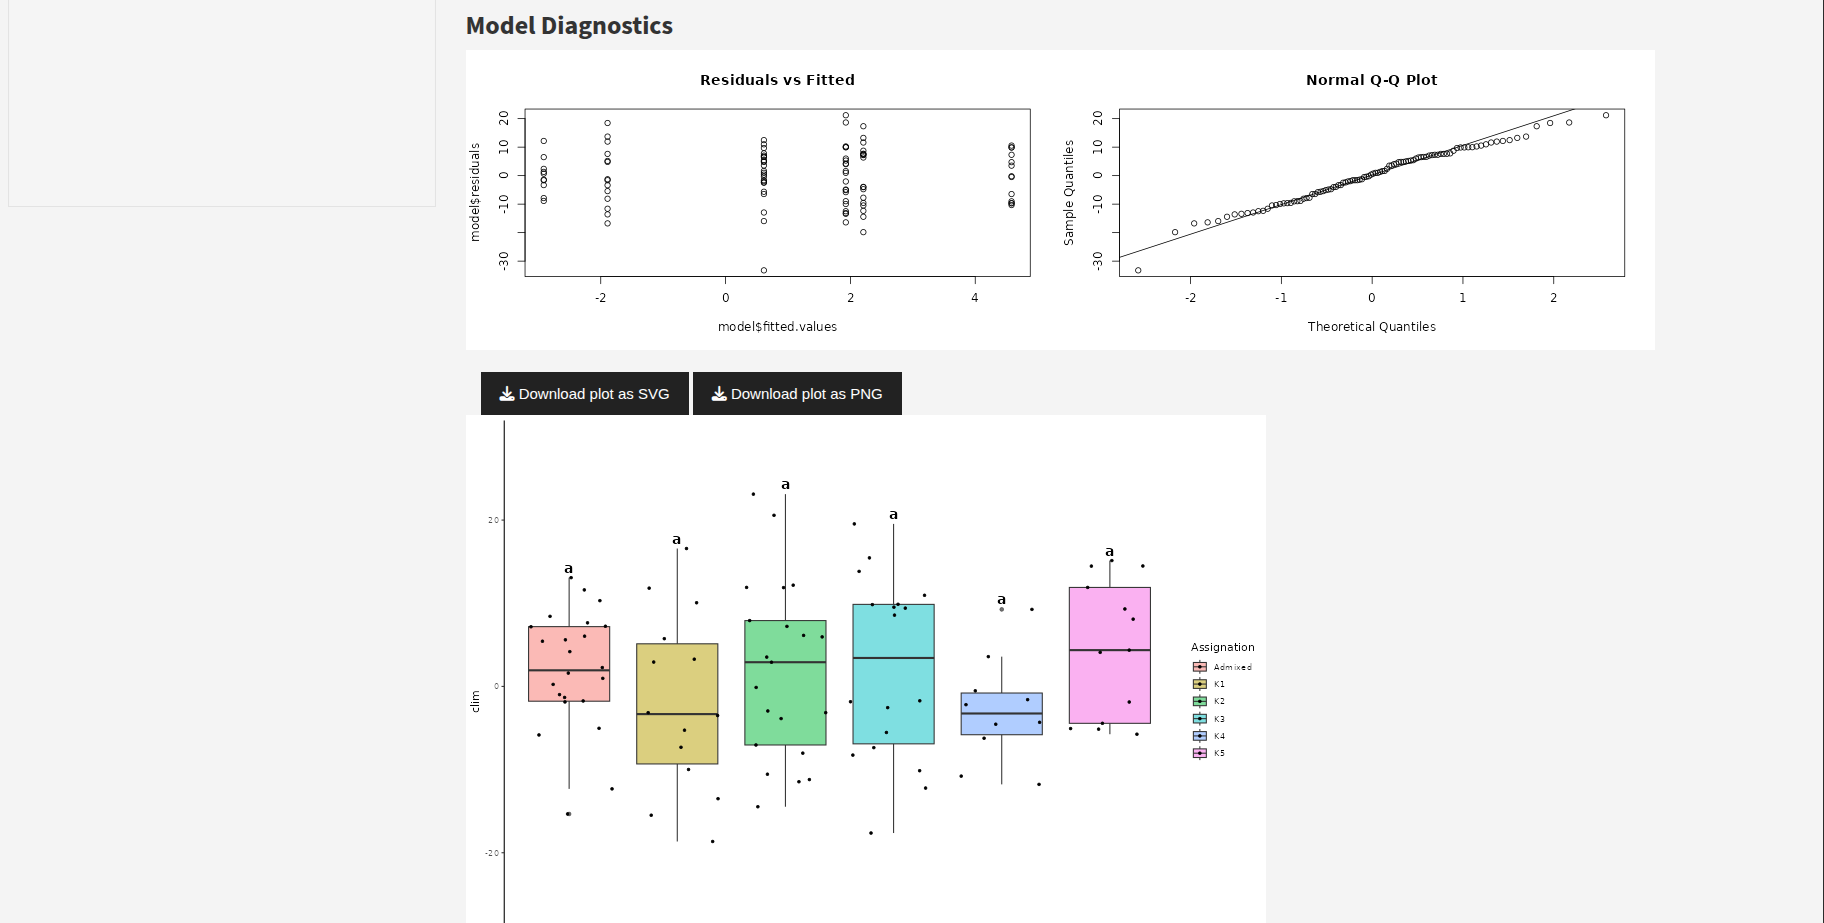
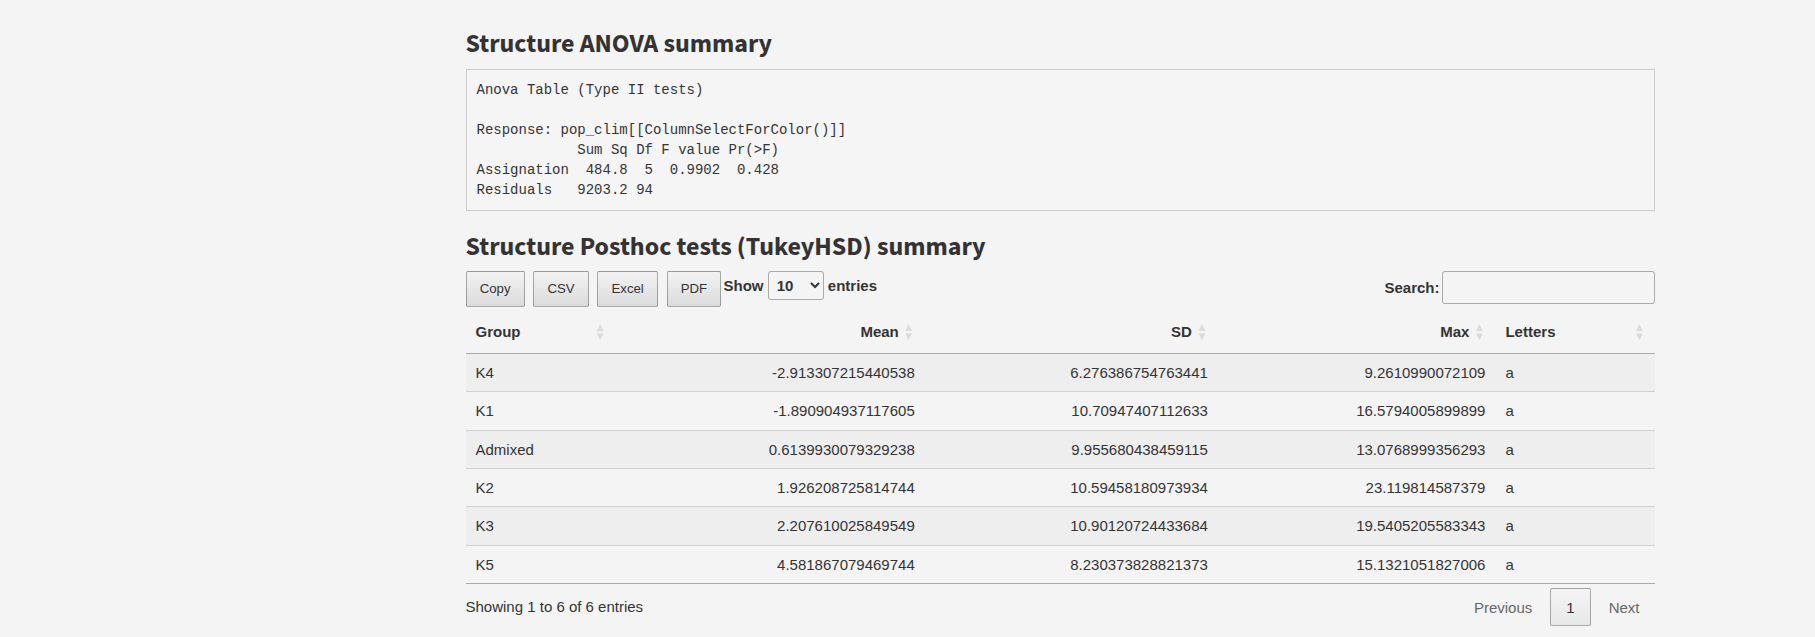
3. Interpreting the Results
ANOVA Table: Shows the F-statistic and p-value. A small p-value (typically < 0.05) indicates a significant difference between group means.
Box Plot or Violin Plot: Visualizes the distribution of the selected variable for each structure group.
Post-hoc Test: Letters indicate which groups are significantly different.
Example: ANOVA results and box plot for the selected variable and structure groups.
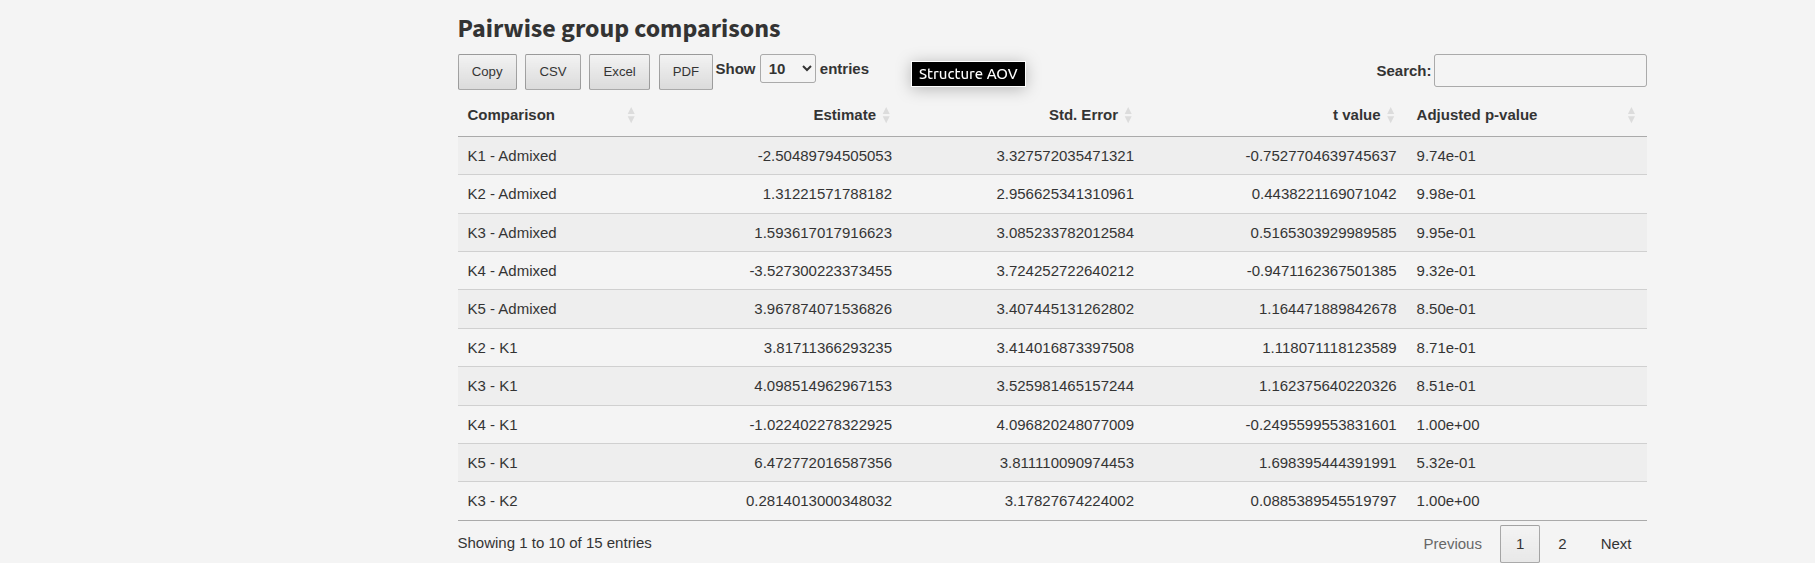
Example: Post-hoc test results showing group differences.
4. Exporting Results
After performing ANOVA analysis, you can export your results in several formats:
Export ANOVA Table: Download the ANOVA results table as a CSV file
Export Plot: Save the box plot or violin plot as a PNG image
Export Post-hoc Results: Download the post-hoc test results as a CSV file
5. Best Practices
Use the Map panel to select a relevant quantitative variable for your biological question.
Make sure your structure data is correctly merged and the assignation column is present.
Use the post-hoc letters to interpret which groups differ after a significant ANOVA.
Export your results for further analysis or inclusion in reports.
6. Limitations
ANOVA is not available for qualitative variables or if structure data is missing.
If you select a non-numeric variable, the app will notify you that ANOVA cannot be performed.
Next Steps
After running ANOVA, you can further explore your data using the Statistical Analysis section or visualize the results on the map.