Welcome to the GeoPopMap Tutorial
Project Contributors
Developer & Tutorial Author
Mohamad Yassine (mohamad.a.ysn@gmail.com)
Collaborators
Sarah Ben Sadoun (sarah.ben-sadoun@inrae.fr)
Yannick Olivier (yannick.olivier@inrae.fr)
Stephane Nicolas (stephane.nicolas@inrae.fr)
Franck Gauthier (franck.gauthier@inrae.fr)
Agustin-Oscar Galaretto (agustin-oscar.galaretto@inrae.fr)
Valentin Bourdin (valentin.bourdin1@etu.u-paris.fr)
This tutorial will guide you through the process of using GeoPopMap, a comprehensive R Shiny application for analyzing and visualizing multi-dimensional agricultural data.
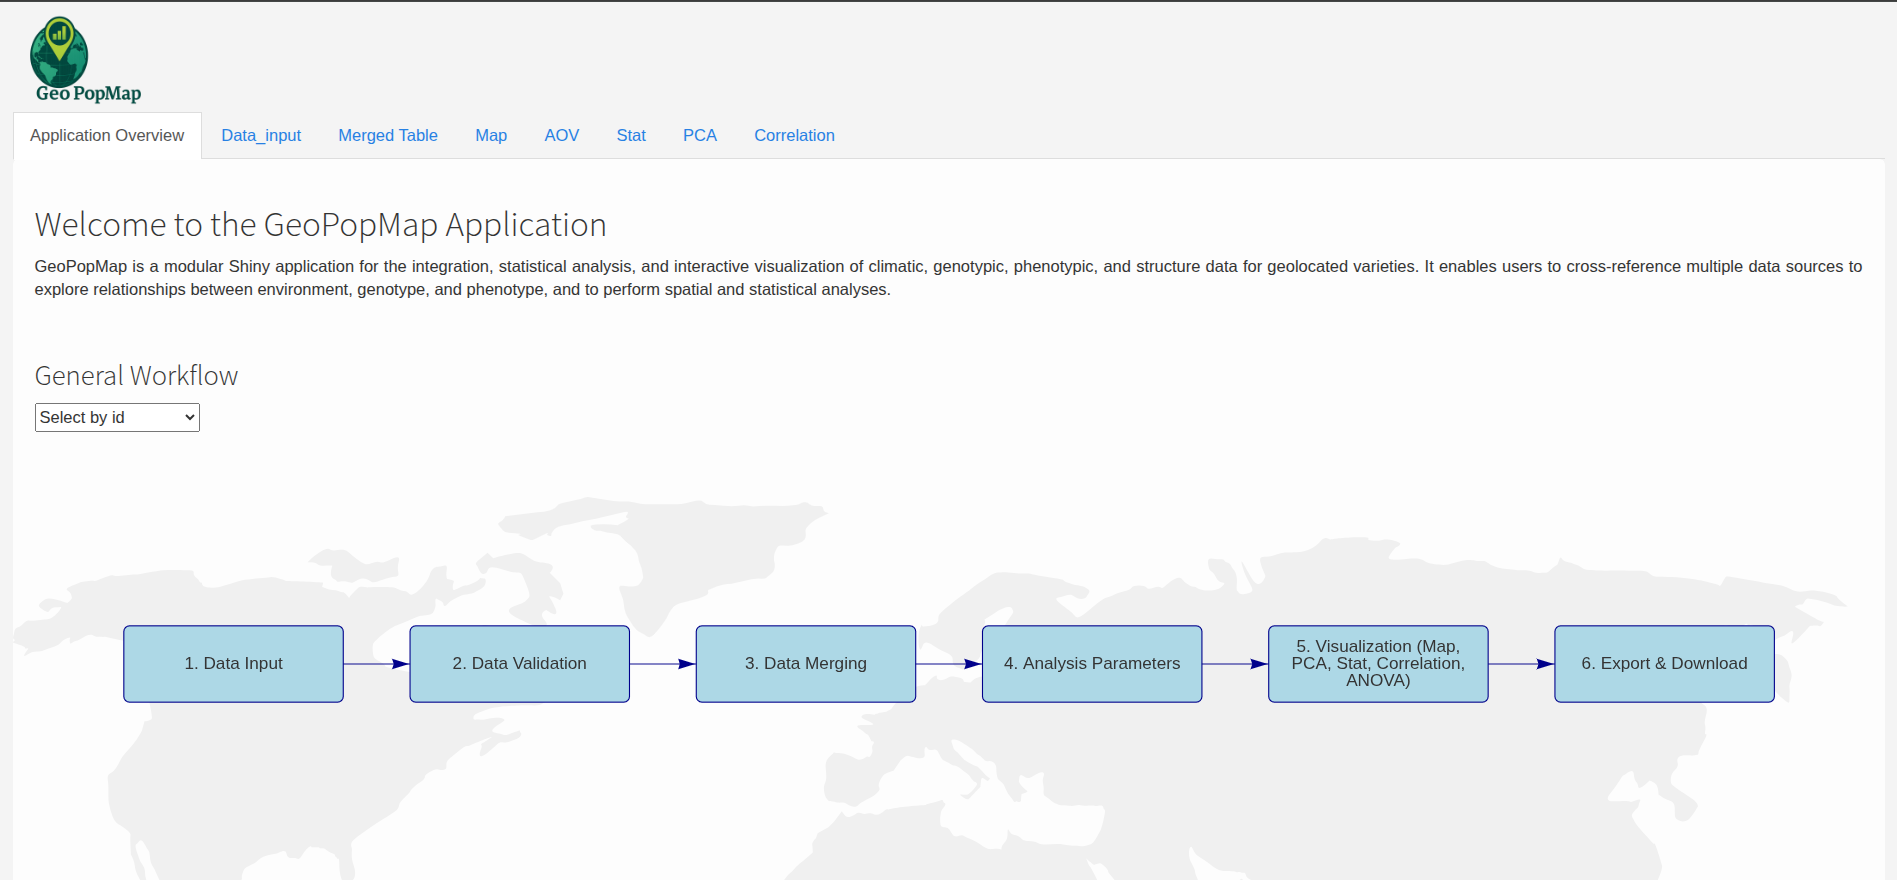
The main interface of the GeoPopMap application.
Getting Started
This tutorial is divided into several sections, each covering a specific aspect of the application. We recommend following them in order to get a complete understanding of the workflow.
Tutorial Contents:
- Prerequisites
- Usage
- Data Management and Merging
- Map Visualization
- Principal Component Analysis (PCA)
- Overview
- 1. Analysis Type: PCA vs PCoA
- 2. Variable Selection
- 3. PCA Parameters
- 4. Visualization Modes
- 5. Grouping and Coloring
- 6. Plot Customization
- 7. Variance Explained
- 8. Variable Contributions
- 9. Data Export
- 10. Interactive Plot
- 11. Handling Missing Data
- 11. Example Workflow
- Best Practices
- Next Steps
- Correlation Analysis
- ANOVA Analysis
- Statistical Analysis
Introduction to GeoPopMap
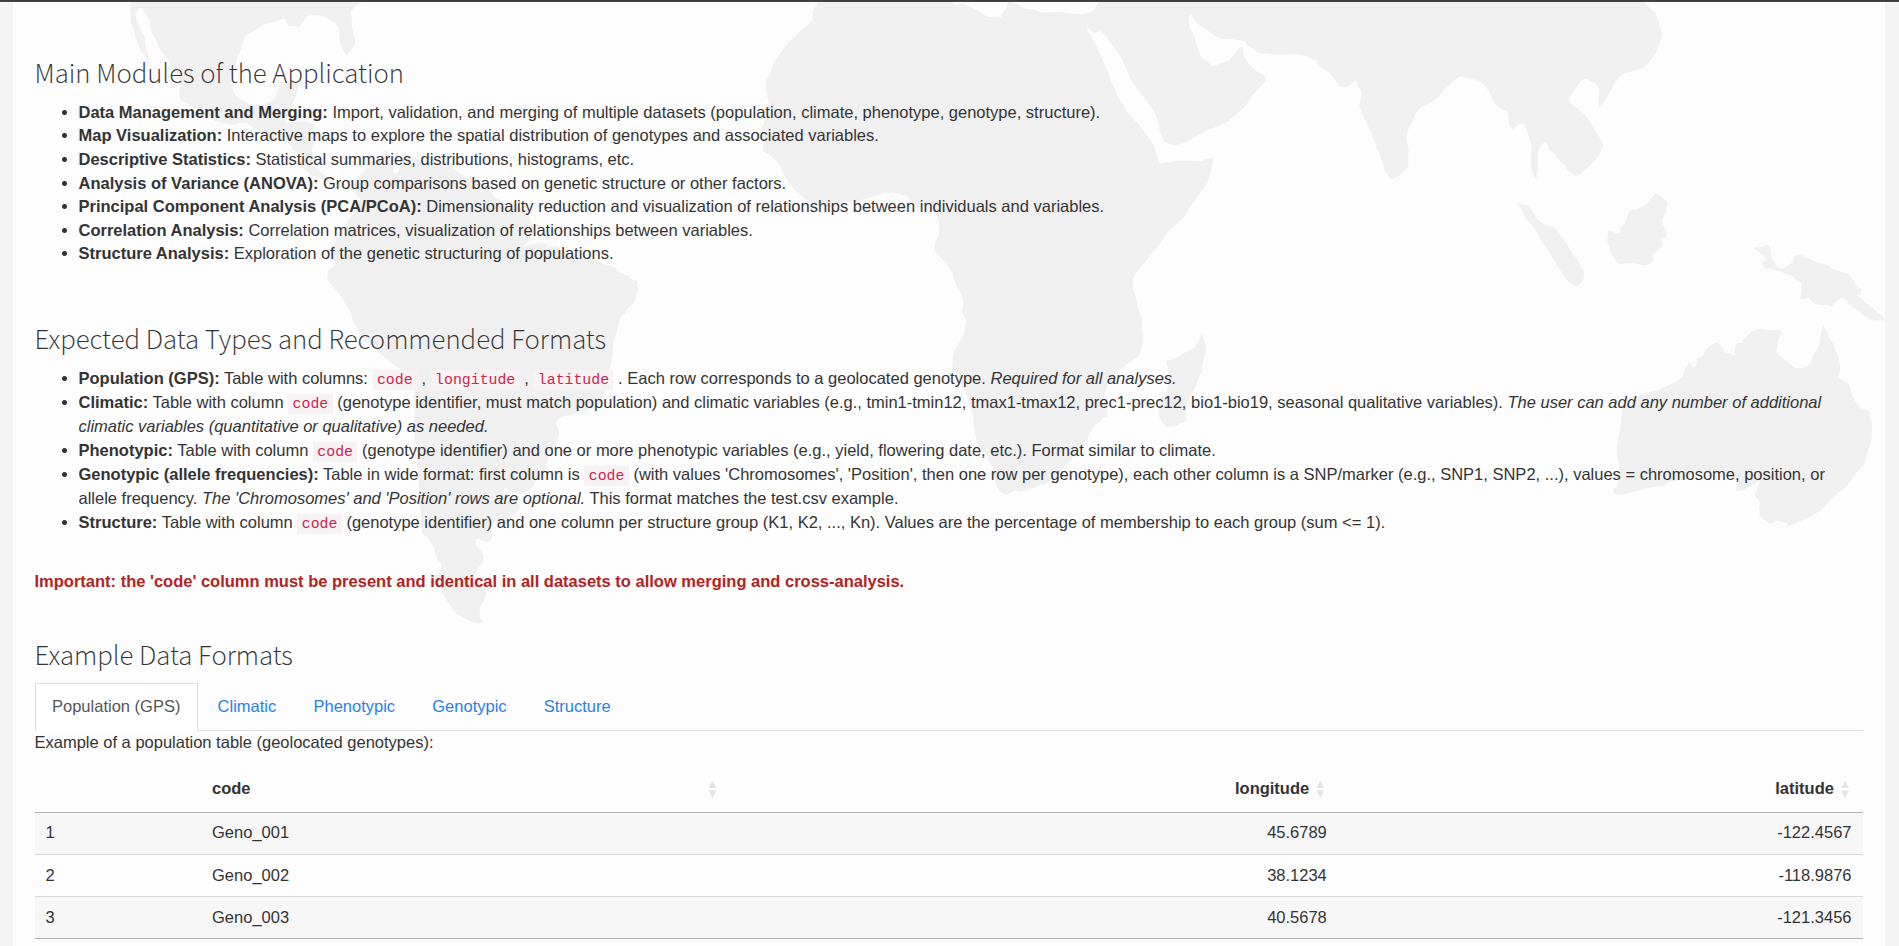
GeoPopMap is a comprehensive R Shiny application designed for the analysis and visualization of multi-dimensional agricultural data. The application provides an integrated platform for handling and analyzing climatic, genotypic, and phenotypic data with a focus on spatial relationships and statistical analysis.
Key Features
Data Upload and Validation: Supports various data formats and validates data to ensure quality.
Data Merging: Merge different datasets to create a comprehensive analysis-ready dataset.
Interactive Map Visualization: Visualize geographic data and explore spatial patterns.
PCA and Correlation Analysis: Perform statistical analyses to uncover relationships in your data.
ANOVA and Statistical Summaries: Conduct analysis of variance and generate statistical summaries.
About This Tutorial
This tutorial is designed to be interactive. At each step, we will show you what to do and what to expect. We will use placeholders for screenshots that you can replace with your own as you follow along.
Let’s begin by setting up the required prerequisites.