Statistical Analysis
This section explains how to use the statistical analysis features in GeoPopMap, including how to visualize the distribution of a variable for all data or only for the points selected on the map.
1. The Statistical Analysis Interface
Navigate to the “Statistical Analysis” tab. Here you can select a variable and generate descriptive statistics and distribution plots.
The main interface for statistical analysis.
2. Variable Selection and Data Scope
Variable Selection: Choose the variable for which you want to see the distribution and summary statistics.
Data Scope: - By default, statistics and plots are computed for all data points. - If you have selected points or a region on the map, you can choose to compute statistics only for the selected subset.
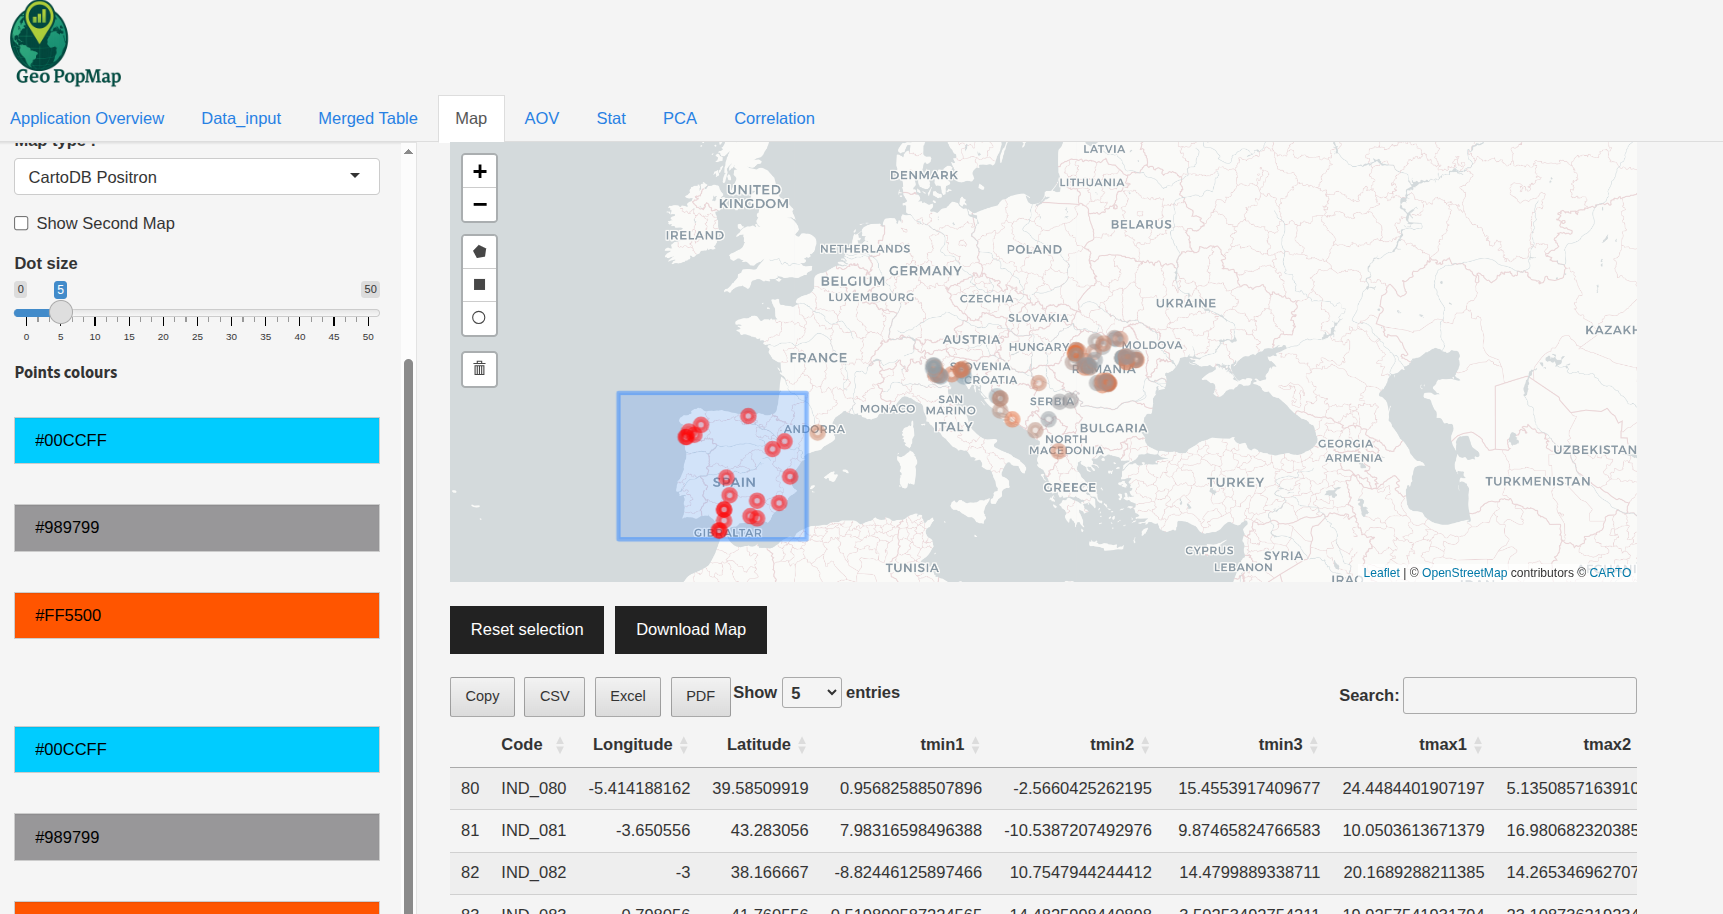
Example: Selecting points on the map to restrict the statistical analysis to a subset.
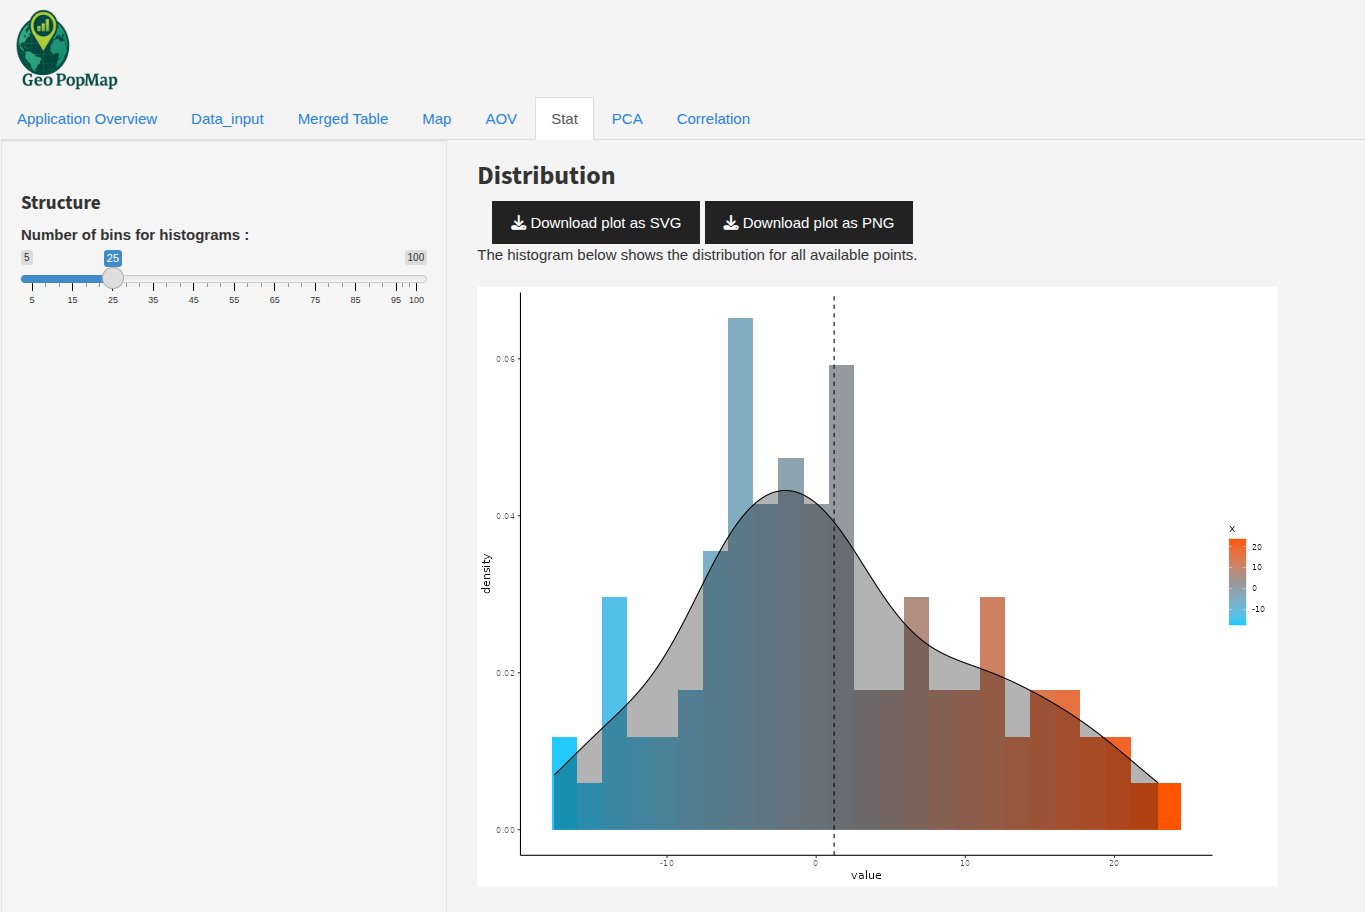
3. Distribution and Summary for All Data
When no selection is made on the map, the distribution and summary statistics are computed for the entire dataset.
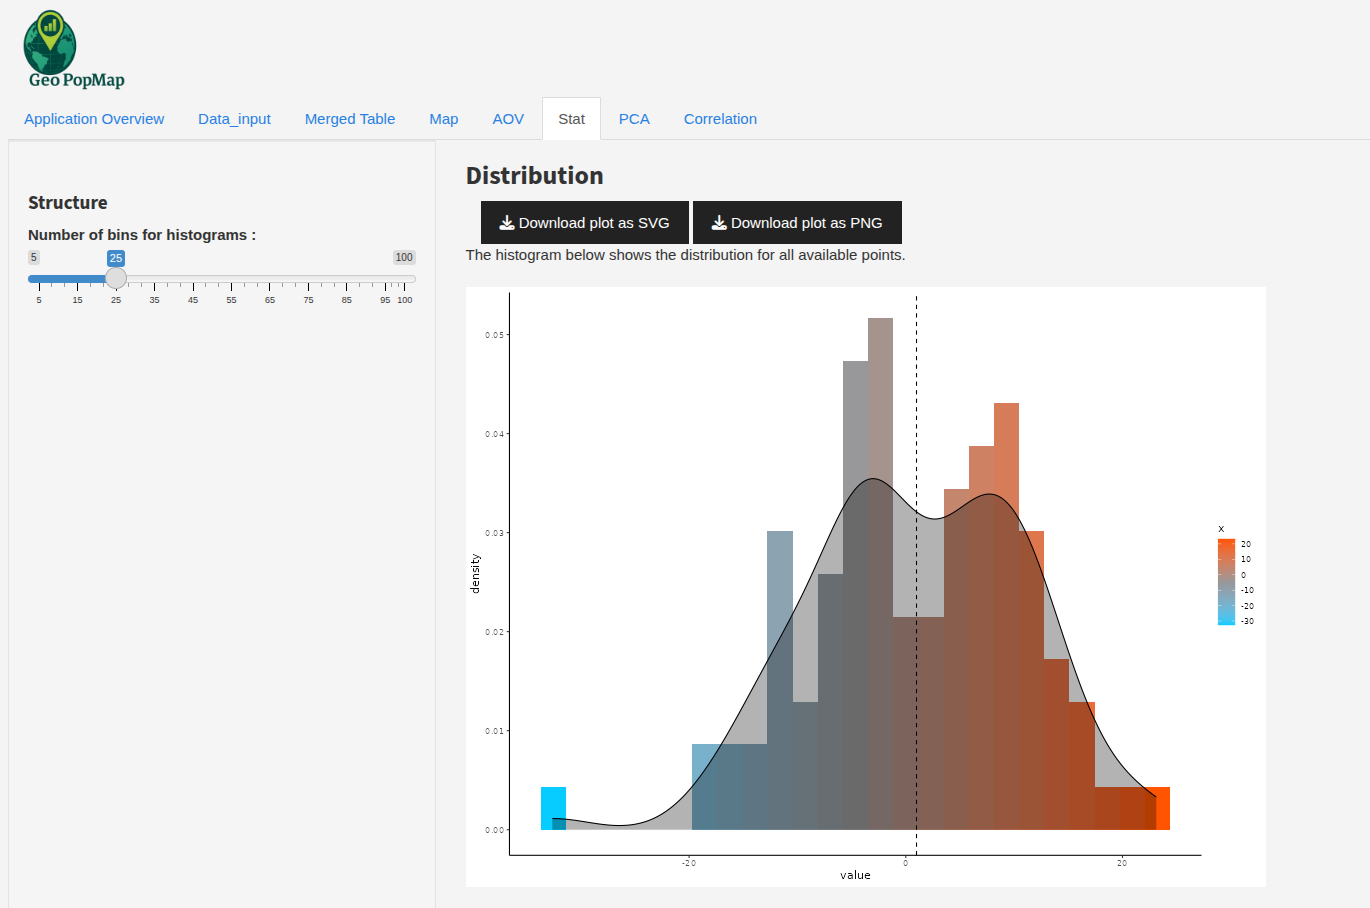
Example: Distribution plot and summary statistics for all data points.
4. Distribution and Summary for Selected Data
When you select points or a region on the map, the distribution and summary statistics are updated to reflect only the selected data.
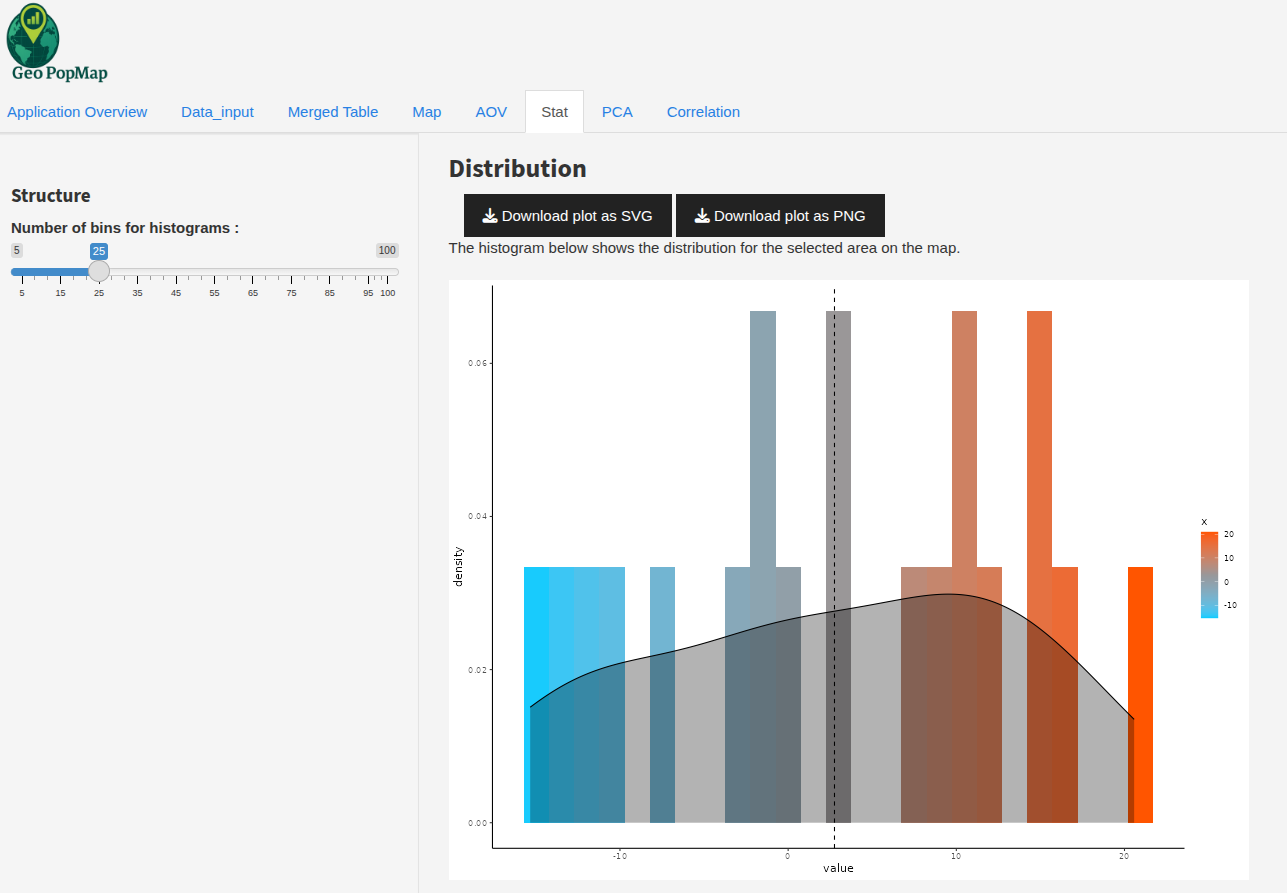
Example: Distribution plot and summary statistics for the selected points.
Example: Table of summary statistics for the selected points.
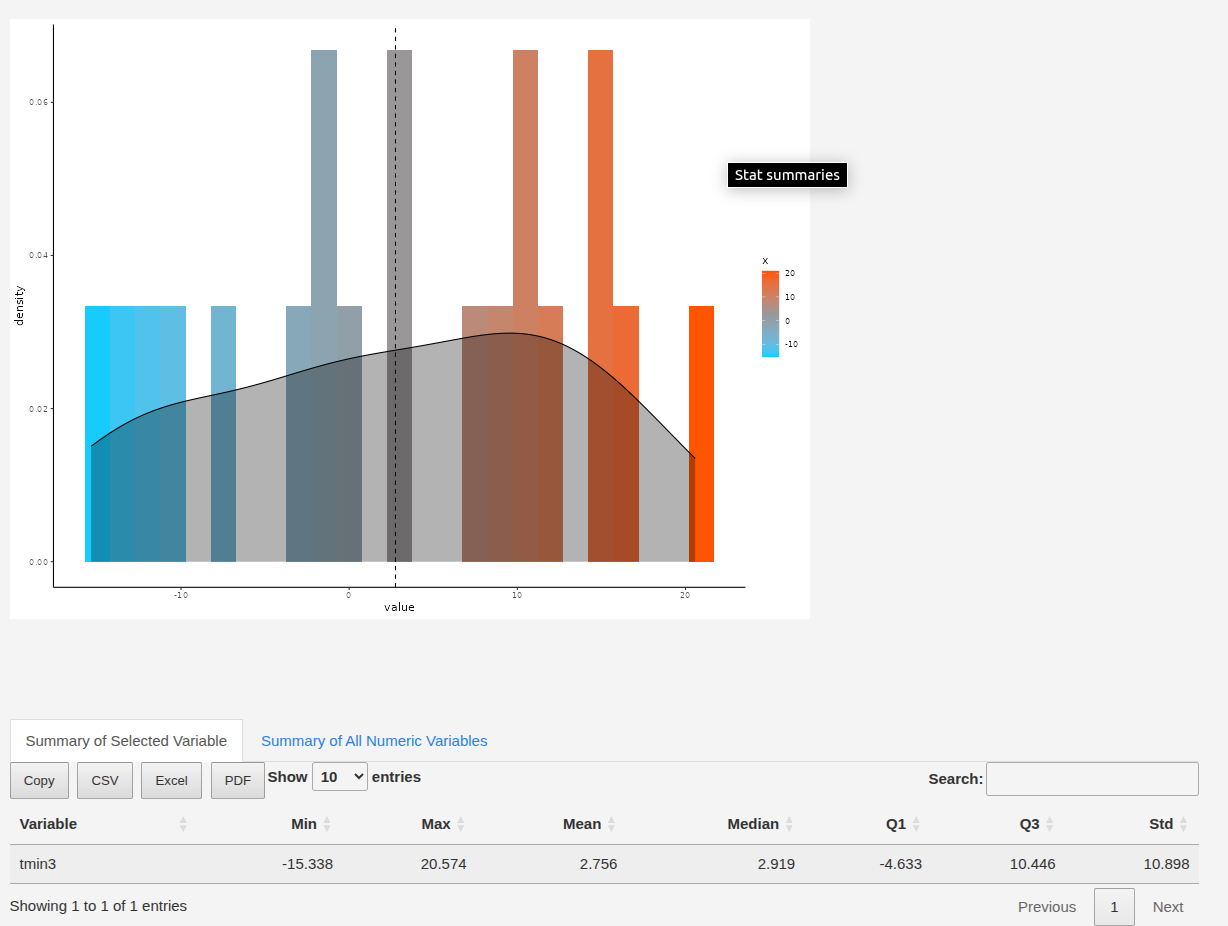
5. Interpreting the Results
Histogram/Distribution Plot: Visualizes the distribution of the selected variable for the chosen data scope.
Summary Table: Shows mean, median, min, max, standard deviation, and other statistics for the selected variable.
6. Exporting Results
You can download the distribution plot as PNG or SVG.
The summary table can be exported as CSV, Excel, or PDF.
7. Best Practices
Use the map to focus your analysis on specific regions or populations.
Compare the distribution for all data vs. a selected subset to identify local patterns or outliers.
Next Steps
You can now use these statistical tools to better understand your data, either globally or for specific selections made on the map.